
 Image 1 of 5
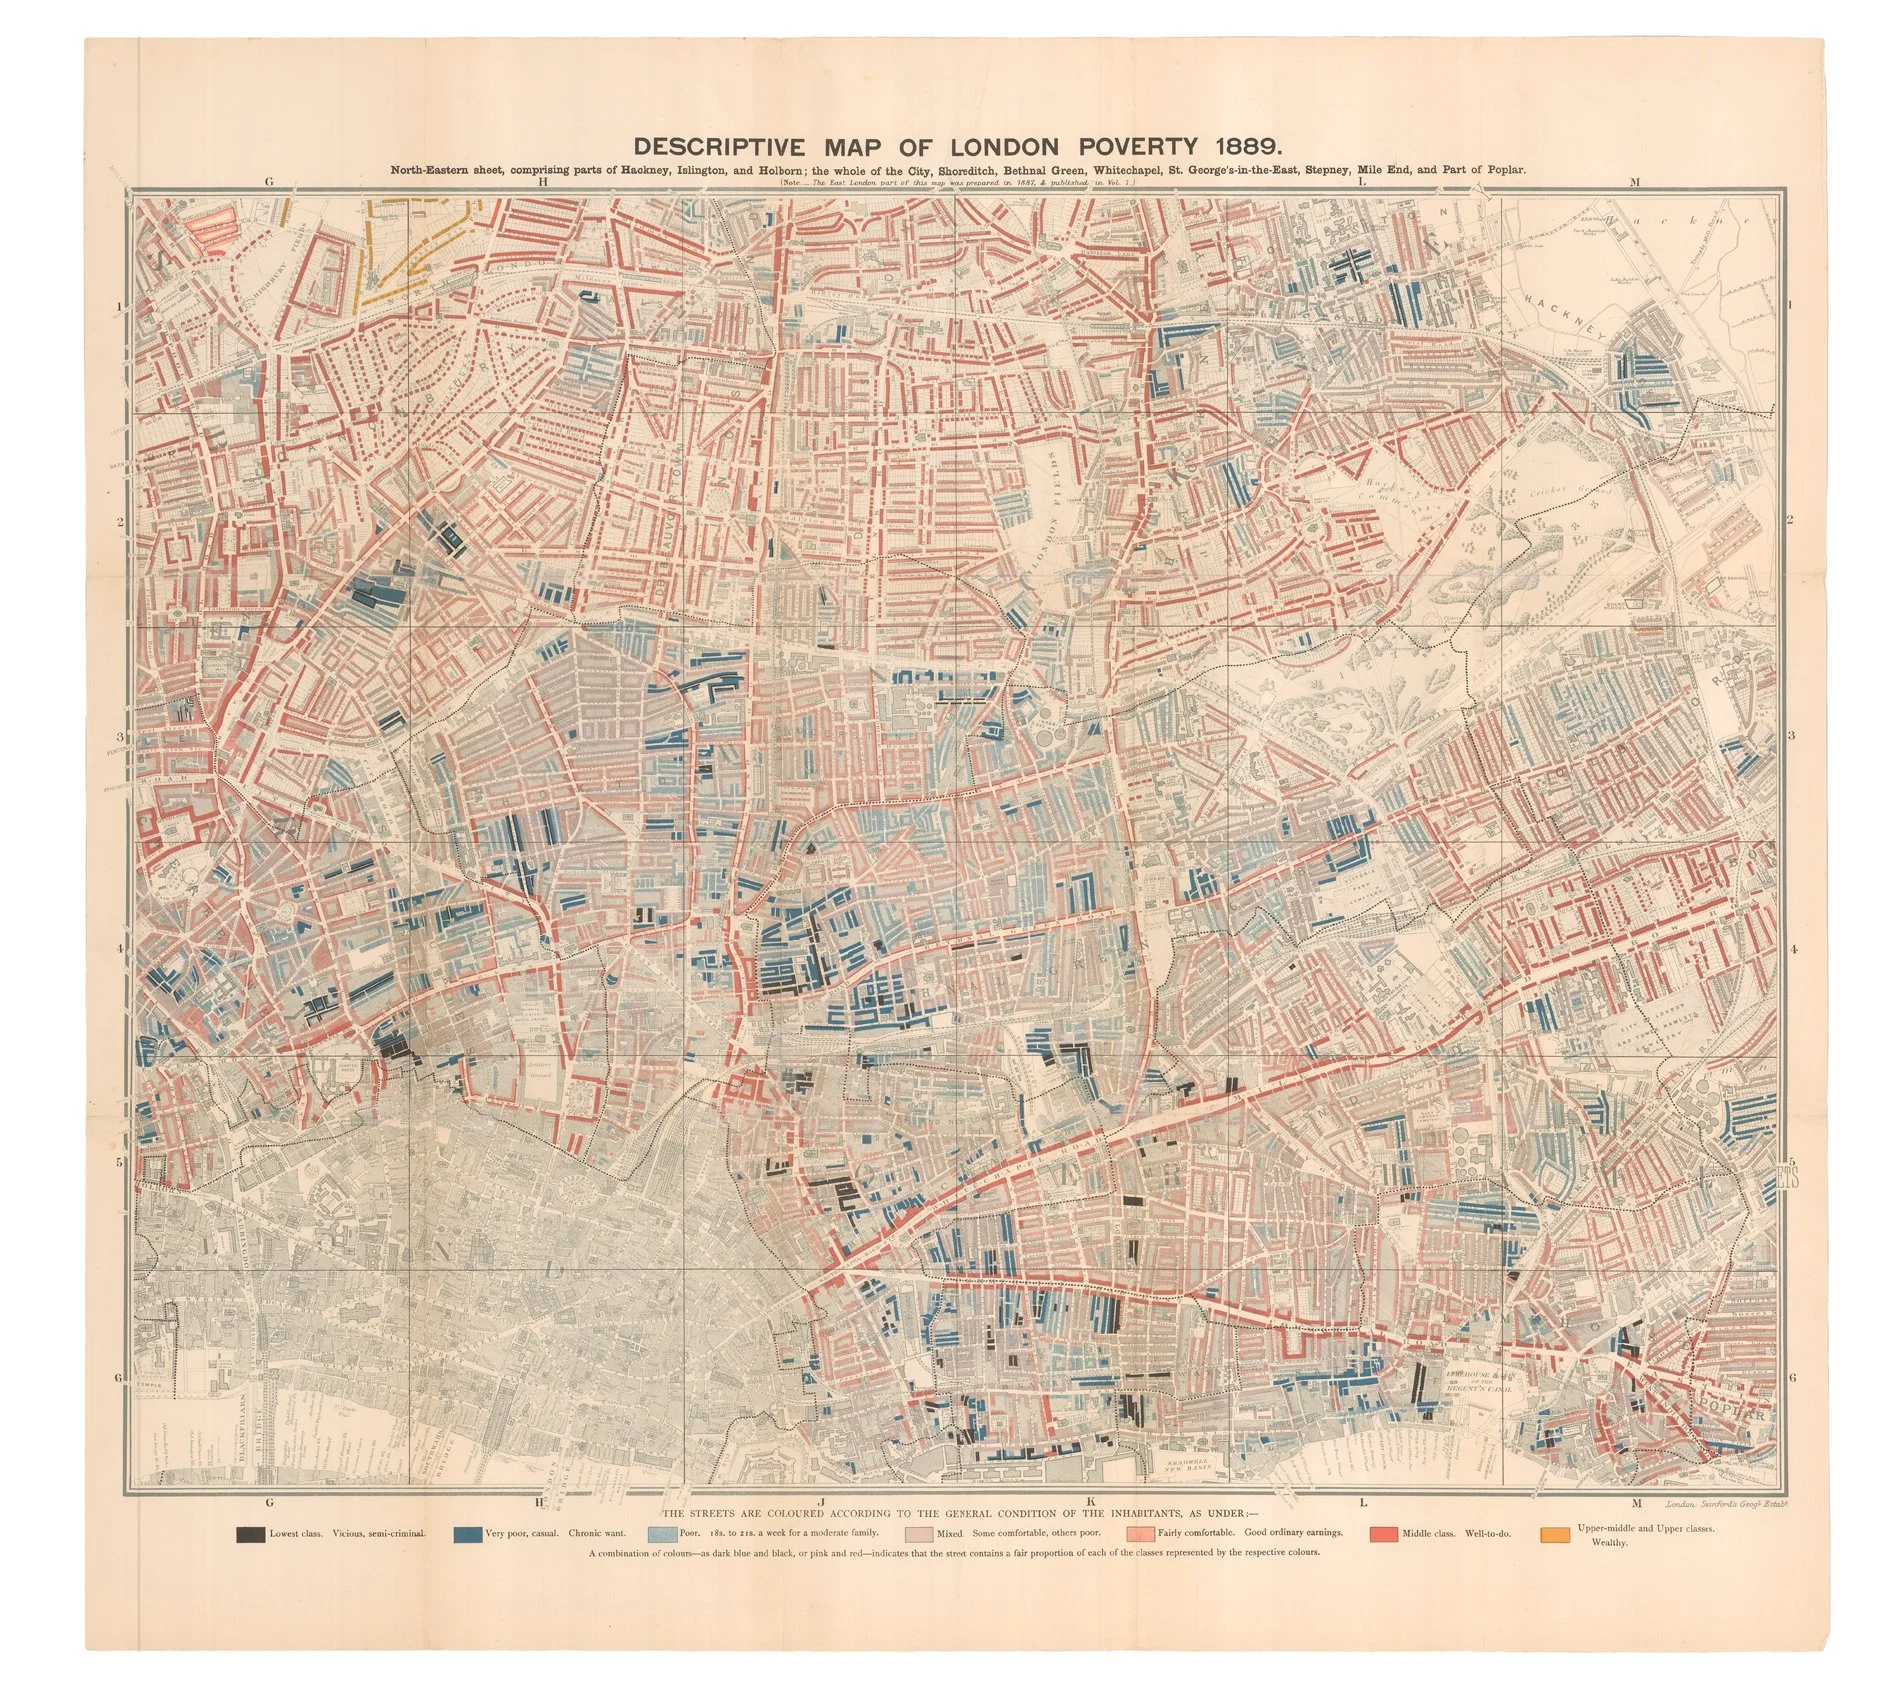 Image 2 of 5
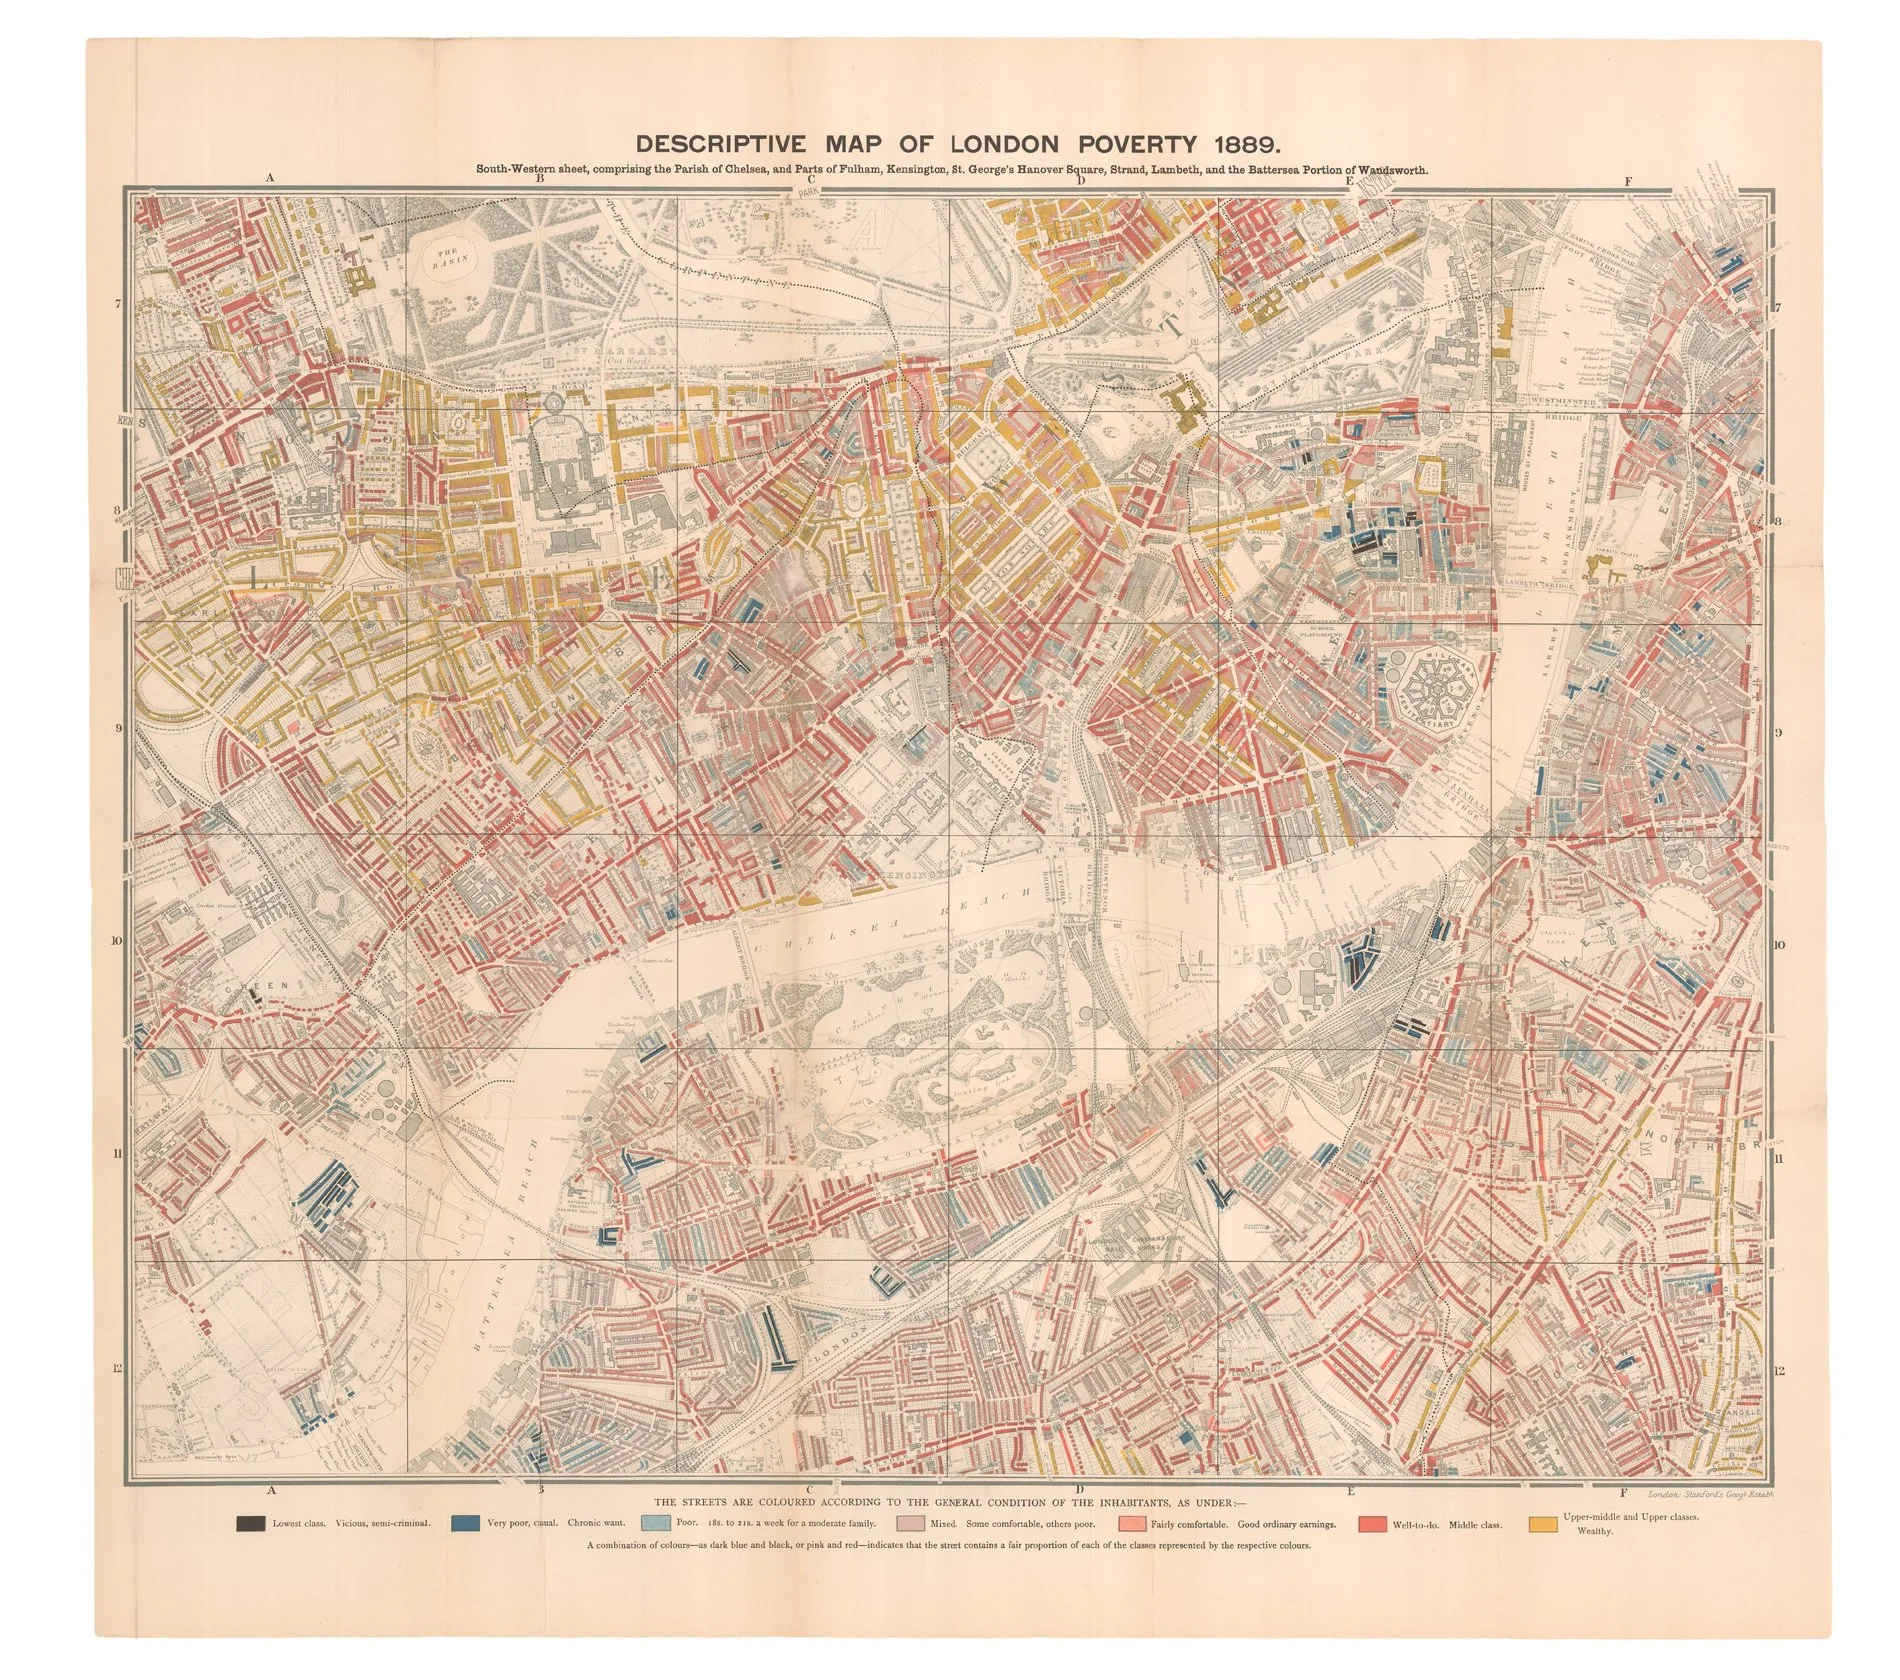 Image 3 of 5
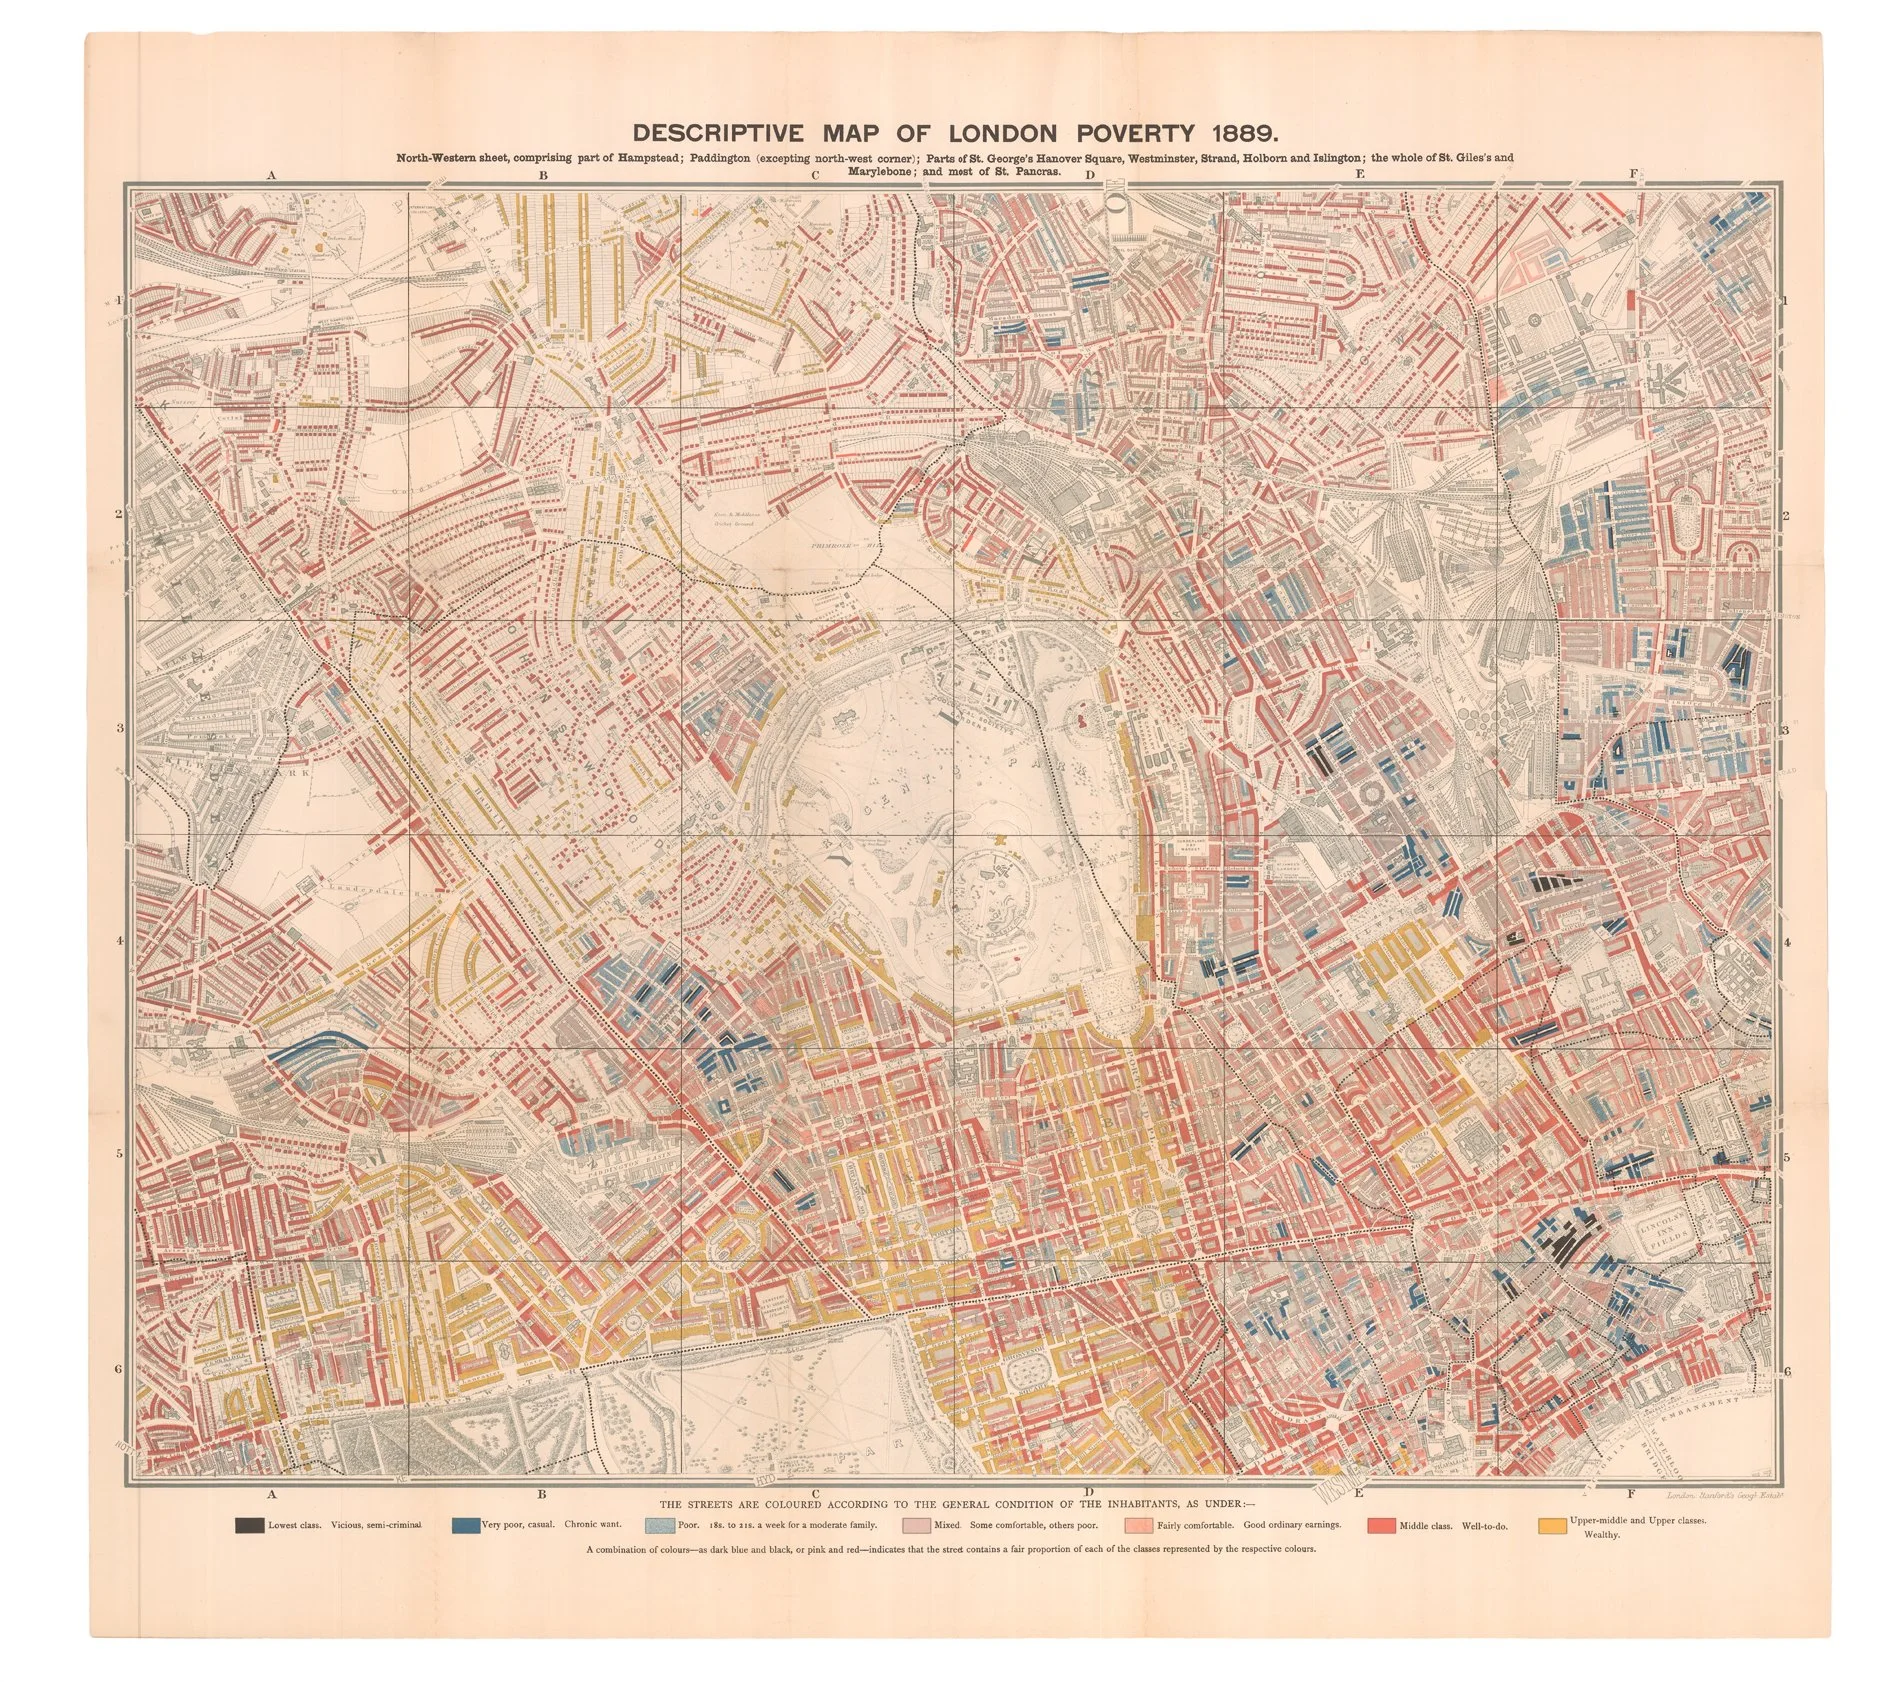 Image 4 of 5
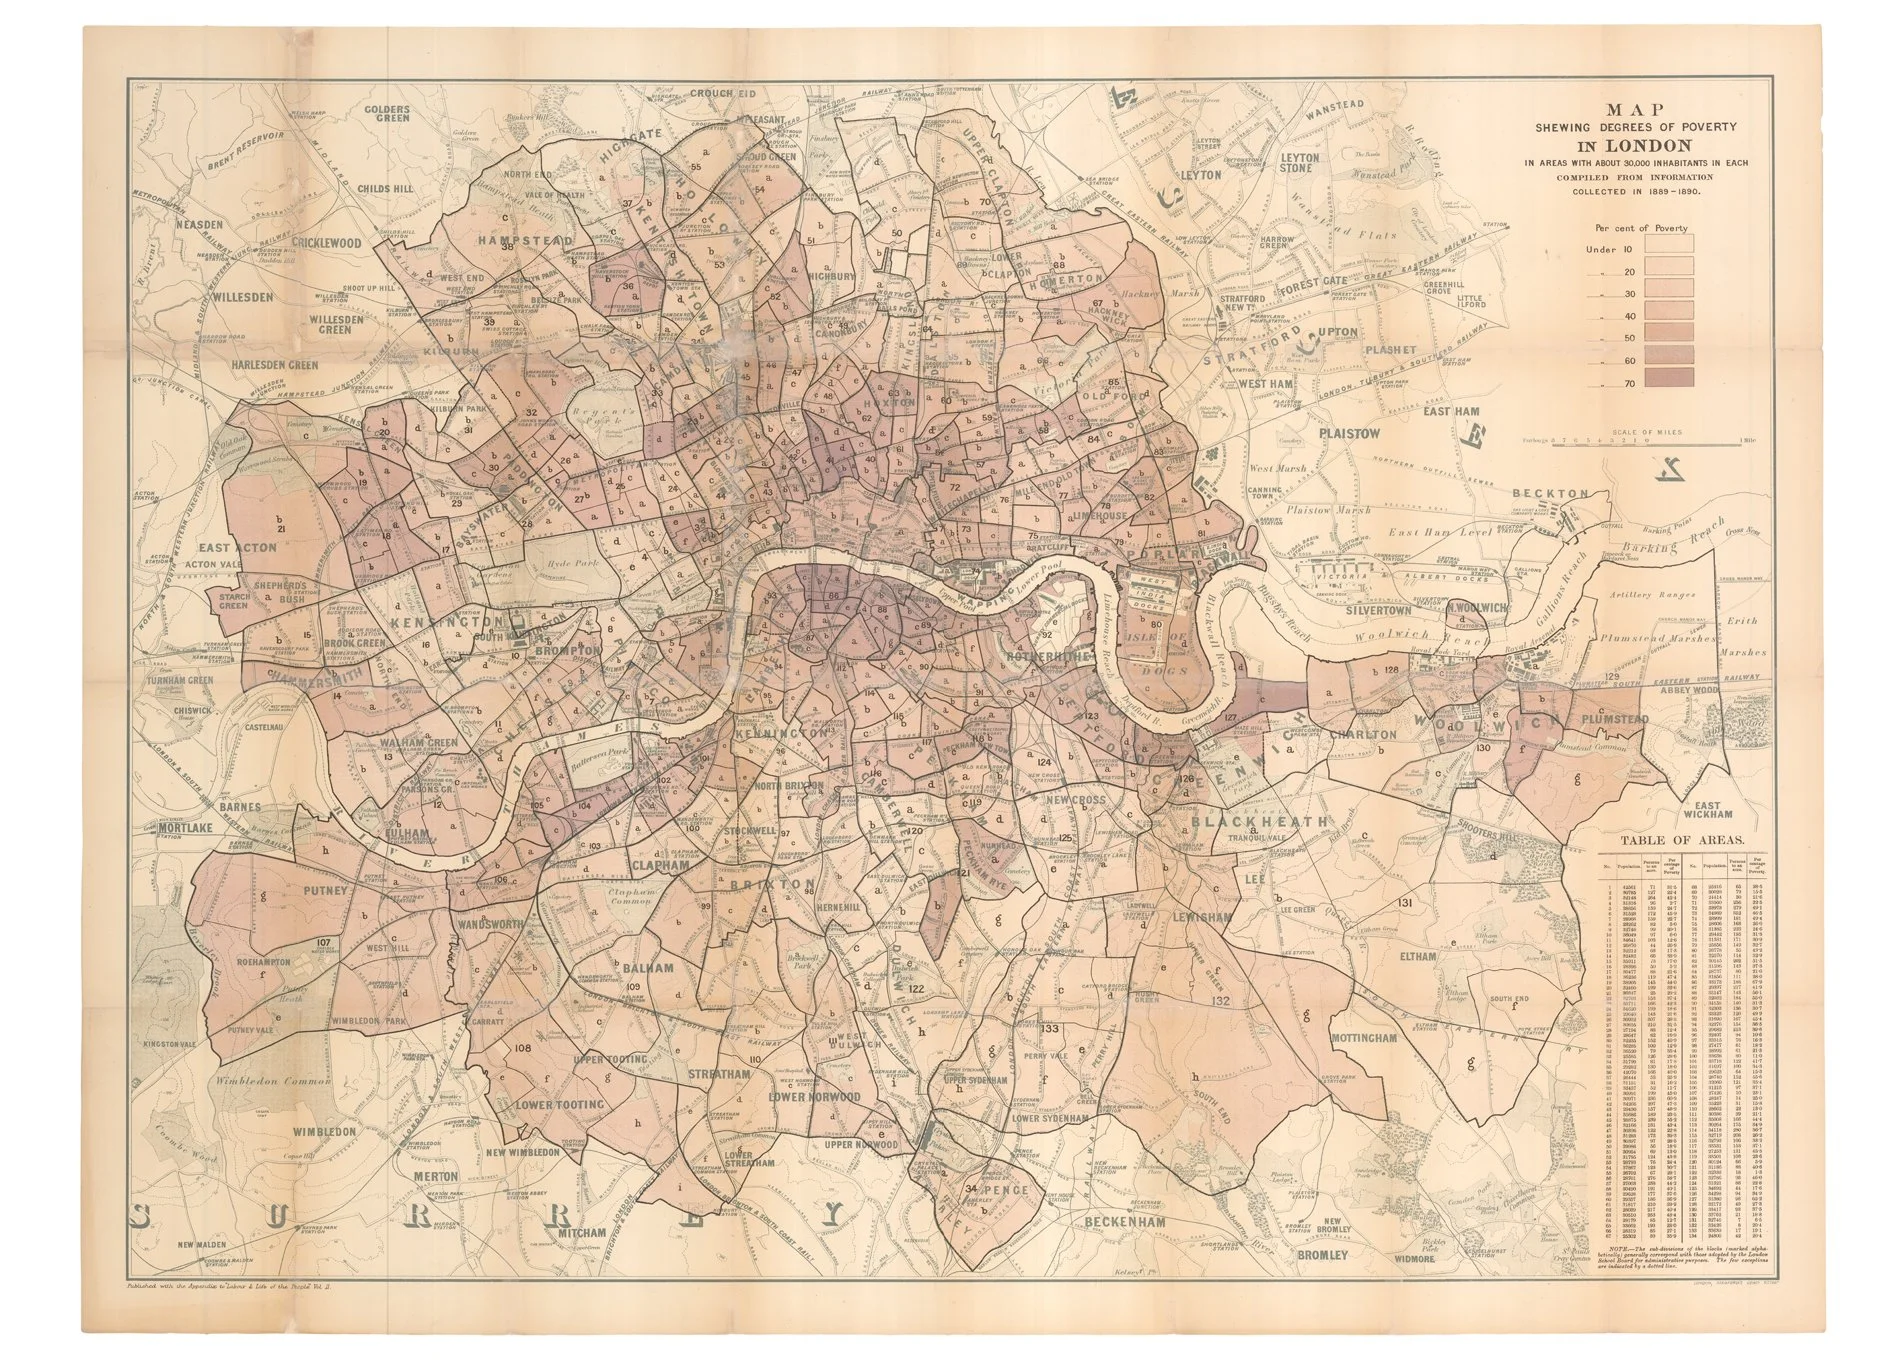 Image 5 of 5
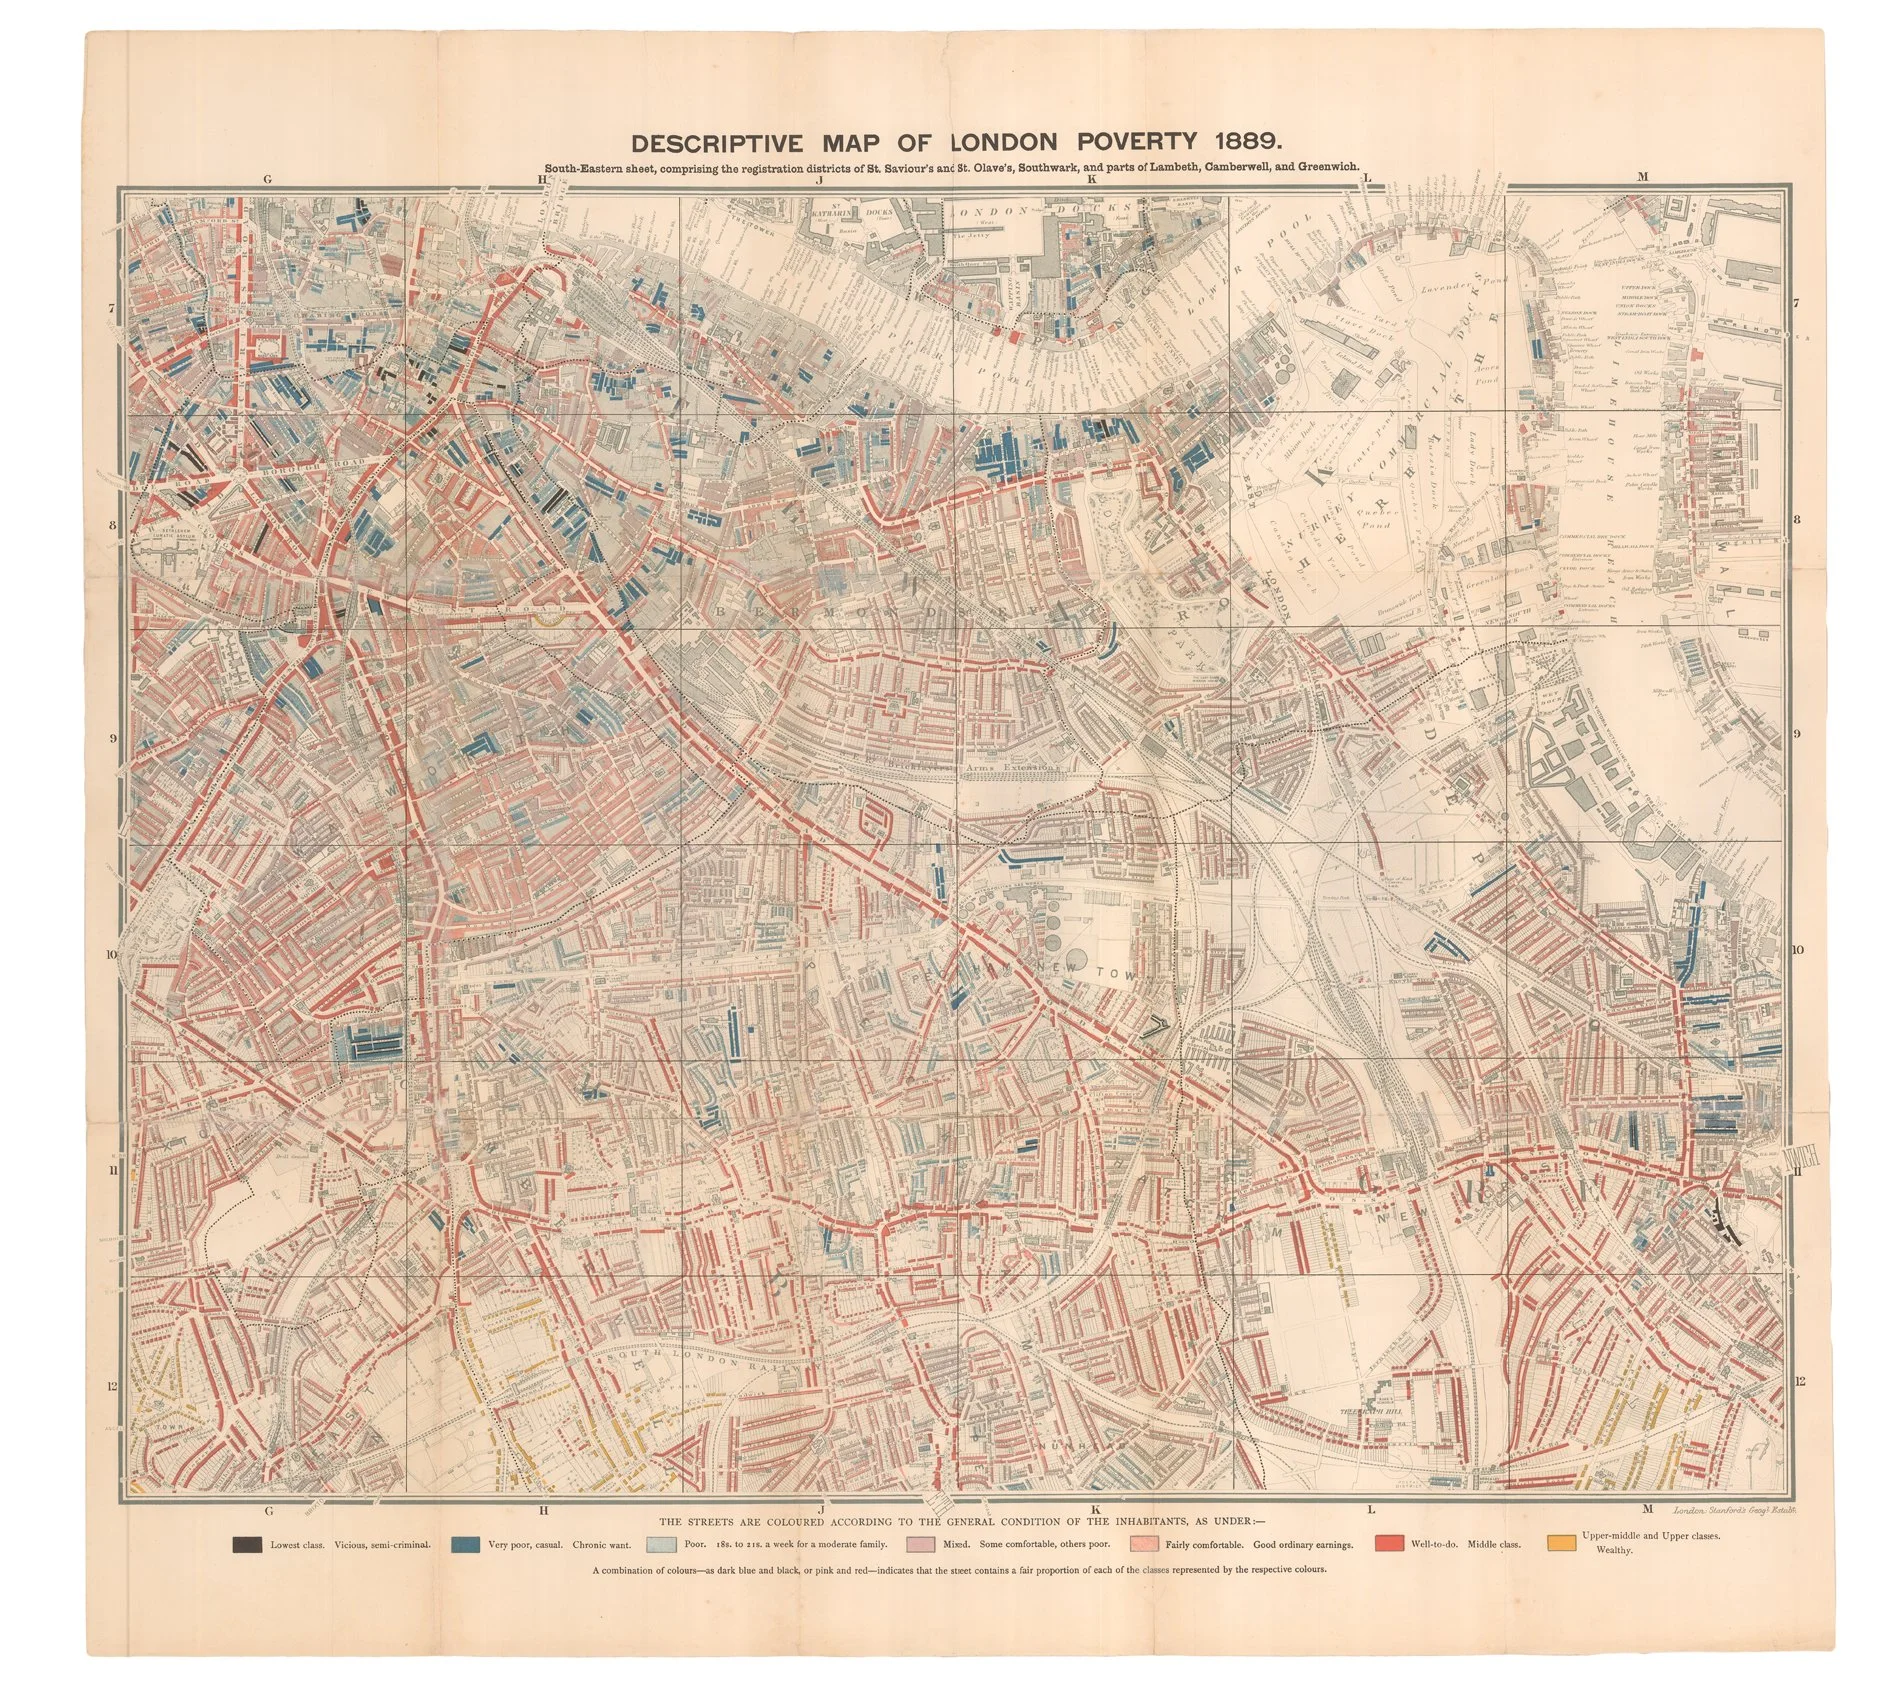
Large chromolithographic map on 4 separate folding sheets (each 462 x 595mm), each with a key showing the streets colour-coded according to the wealth of the inhabitants, contained within an original vellum case, lettered in gilt on spine and with ‘London 1890 1900’ lettered in gilt and set withing gilt shield on upper cover (case slightly soiled). (In very good condition with only a few folds strengthened with Japanese tissue, occasional tiny losses at fold joins.) [with:] Map Shewing Degrees of Poverty in London in areas with about 30,000 inhabitants in each […] London: Stanfords, 1890–1891. Large chromolithographic map (635 x 875mm), dividing the city into areas with colour-coded key illustrating the extent of poverty in each location, based on Stanford’s ‘Library map of London’, with key and table in the upper and lower right corners, respectively, originally published with the appendix to Labour & Life of the People vol. 2 (sheet 692 x 928mm; sometime previously folded and recently laid onto Japanese tissue, restoration to central horizontal creasefold and a few other folds, particularly in area of upper left, with a few tiny losses at fold joins with fractionally larger loss in the Camden/Kentish Town area.)